
Outcomes for the period
Four headline numbers for any date range, each showing its change against the period before.
- Connections
- Contacts saved
- Follow-ups
- People reached
Analytics
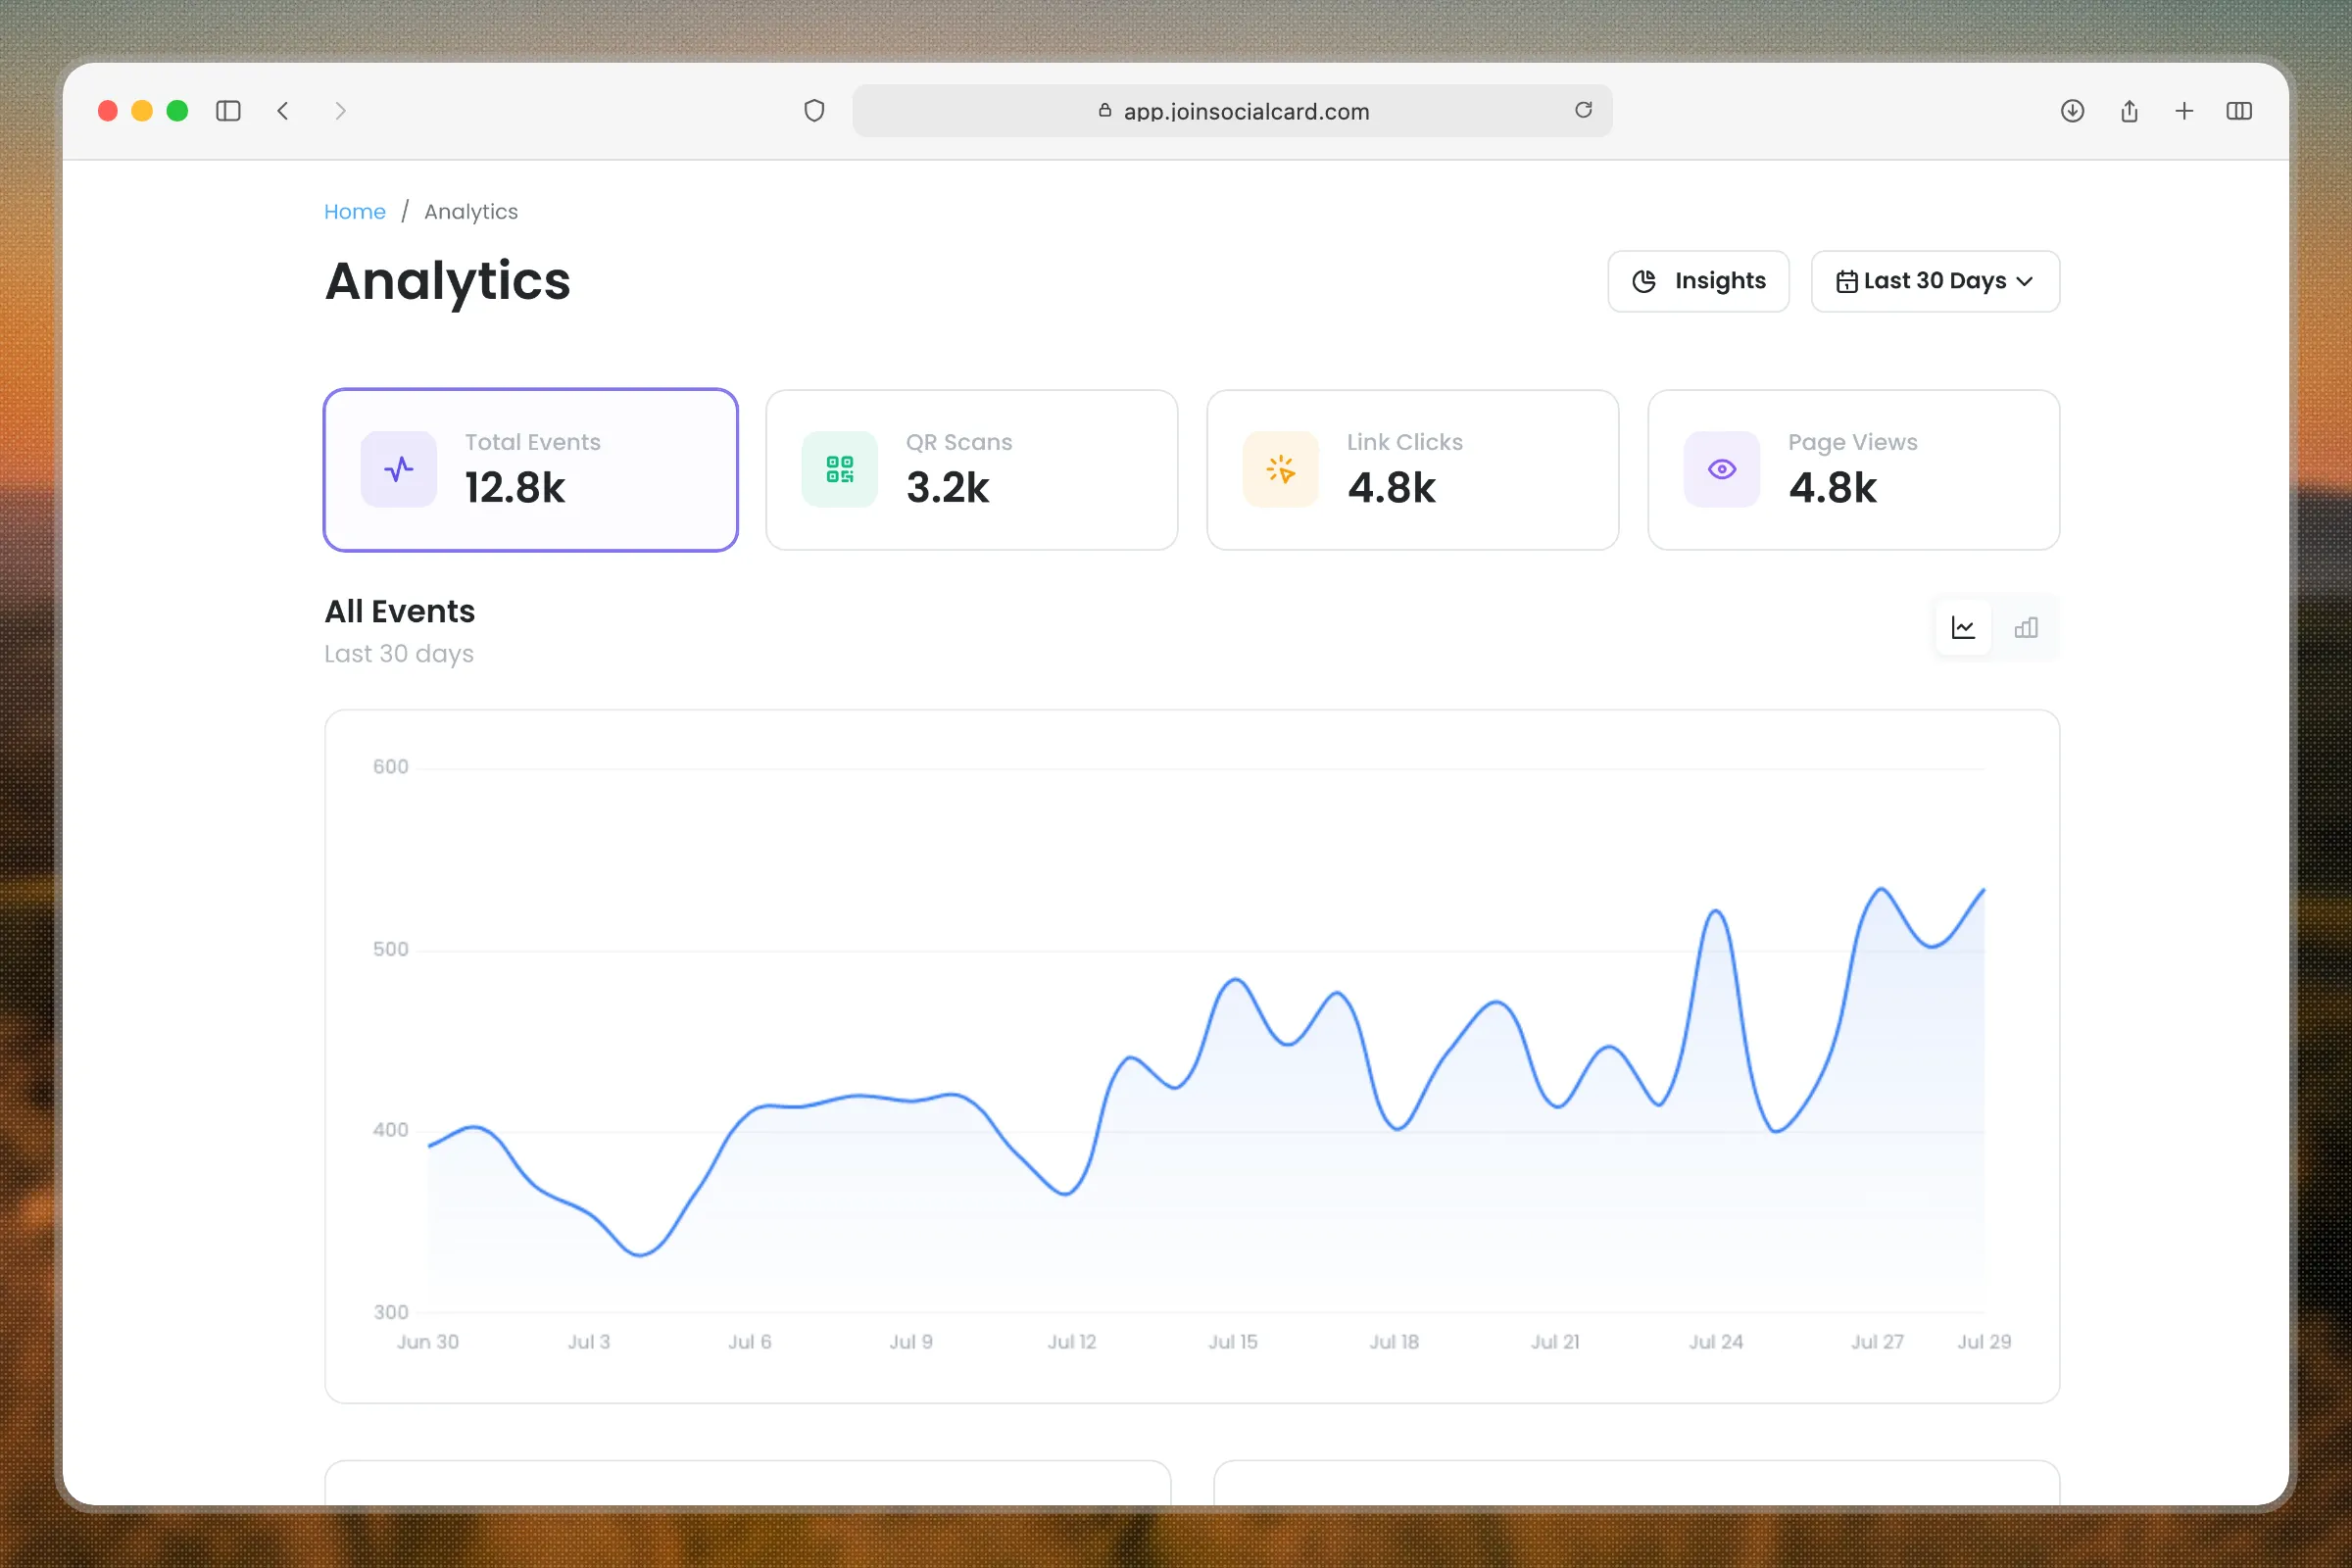
Track the connections, saved contacts, and follow-ups your team produces, and which formats are doing the most work. Optimize your networking based on real usage, not guesswork.
Networking
Analytics opens on the outcomes a people-led team cares about, with every number compared against the previous period.
Four headline numbers for any date range, each showing its change against the period before.
See which format is actually producing contact, and lean the rollout into the channels that work.
Recognize the people and teams doing the work, and spot who is climbing fastest.
Activity
The full event dashboard sits one tab over, on the same date range. Break down views, scans, and clicks by platform, page, geography, or referrer, alongside org-wide totals.
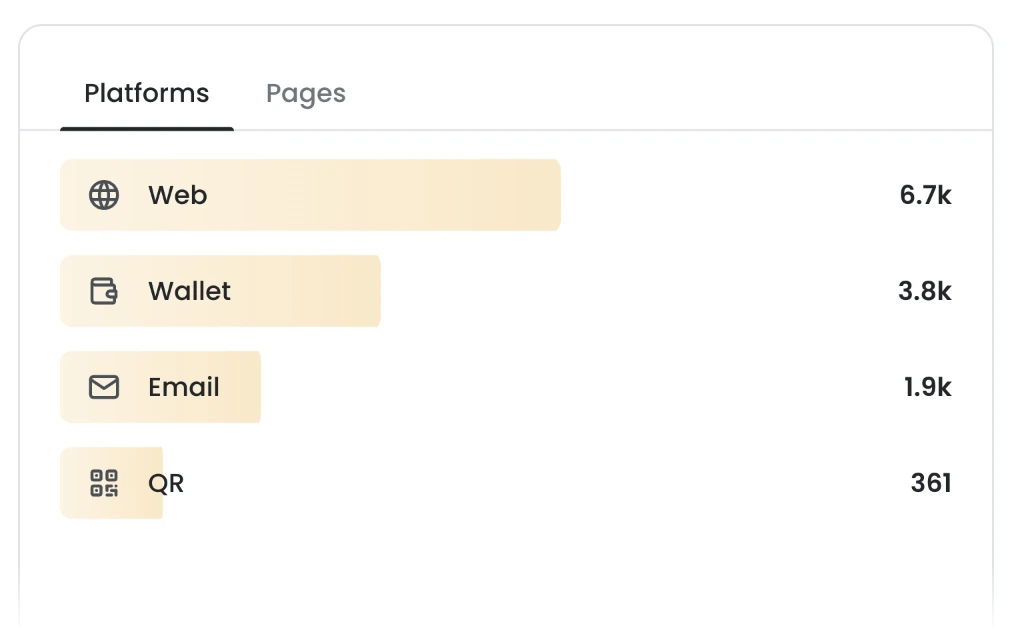
Platforms
Compare web pages, wallet passes, QR codes, and email signatures side by side. Lean into the channels your contacts actually engage with.
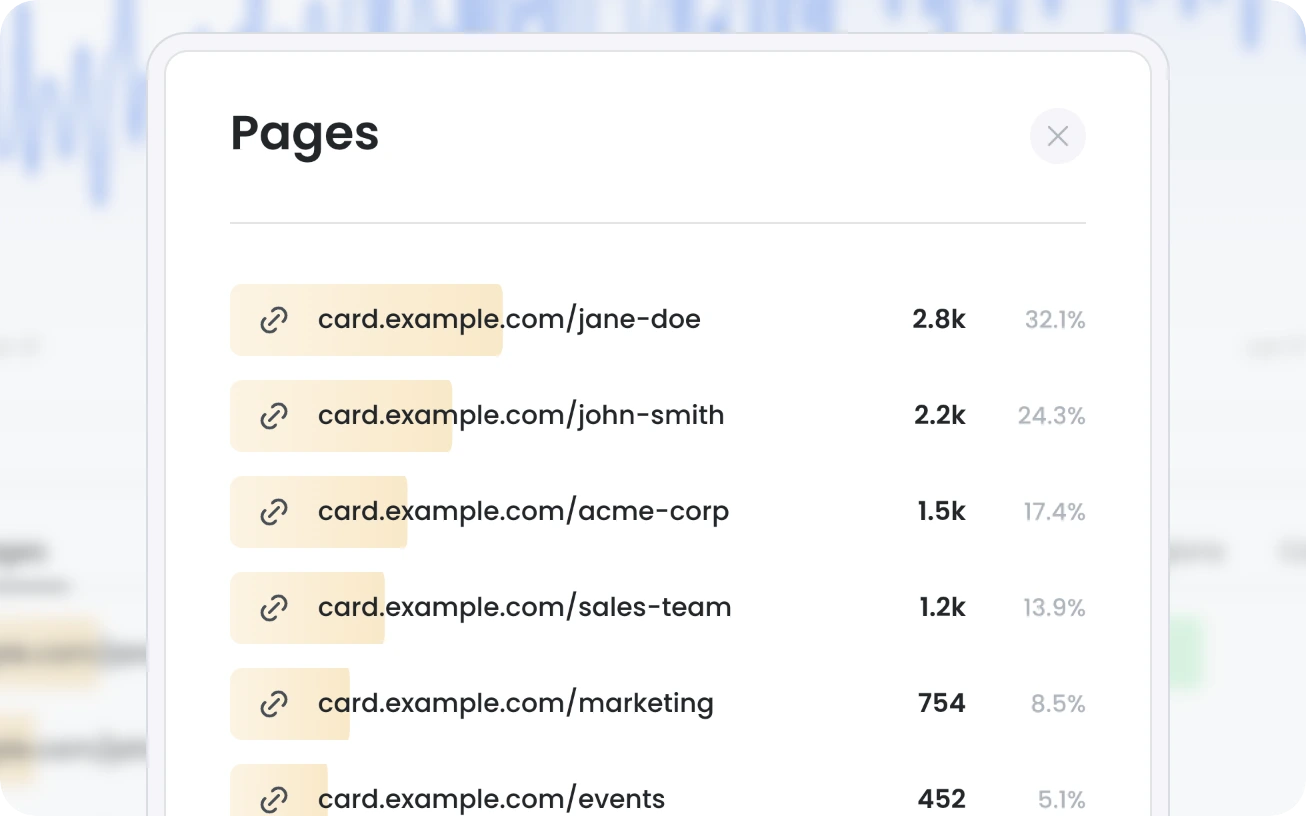
Top pages
Rank cards by traffic to spot your strongest networkers and the ones still finding their stride. Click through for a per-card share of total views.
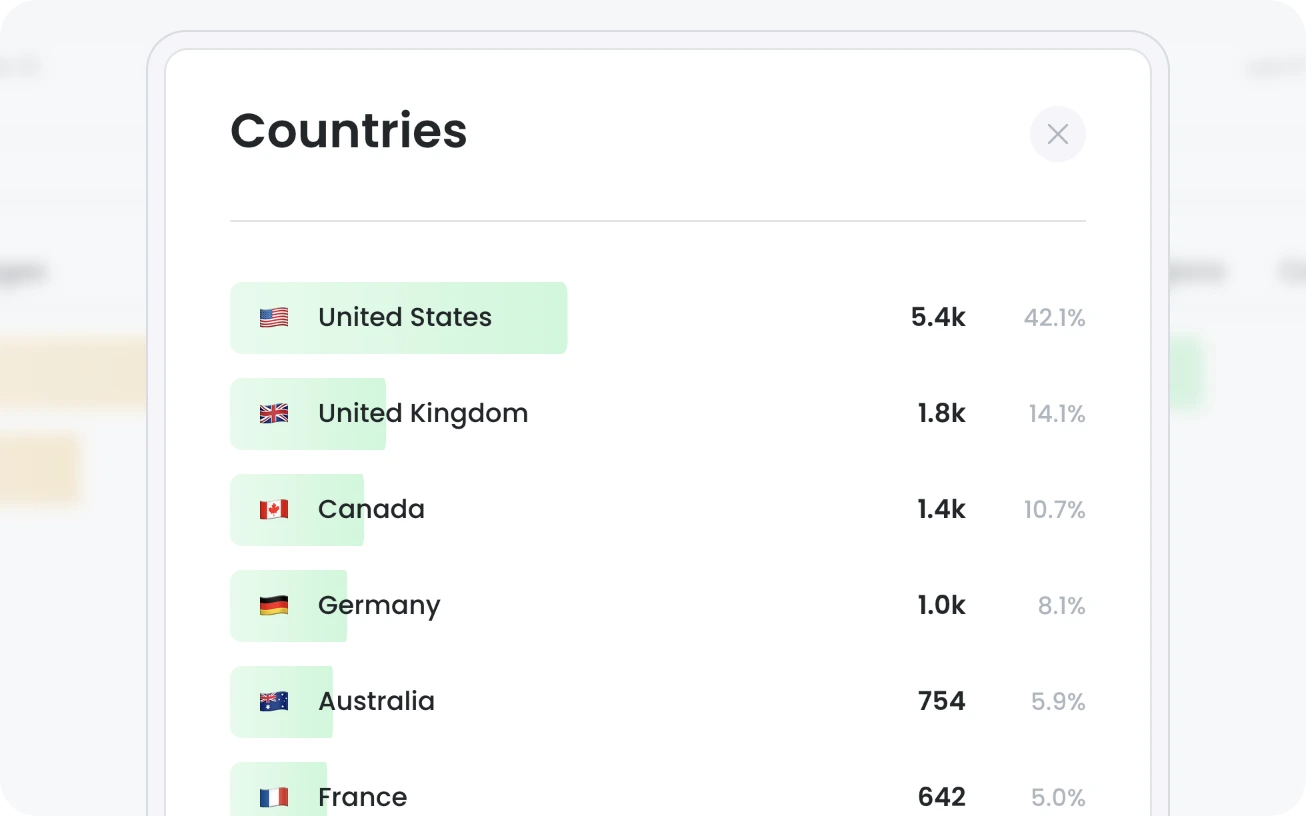
Geography
Track engagement by country, region, or city. See which markets your team is breaking into, and which events drove the spike.
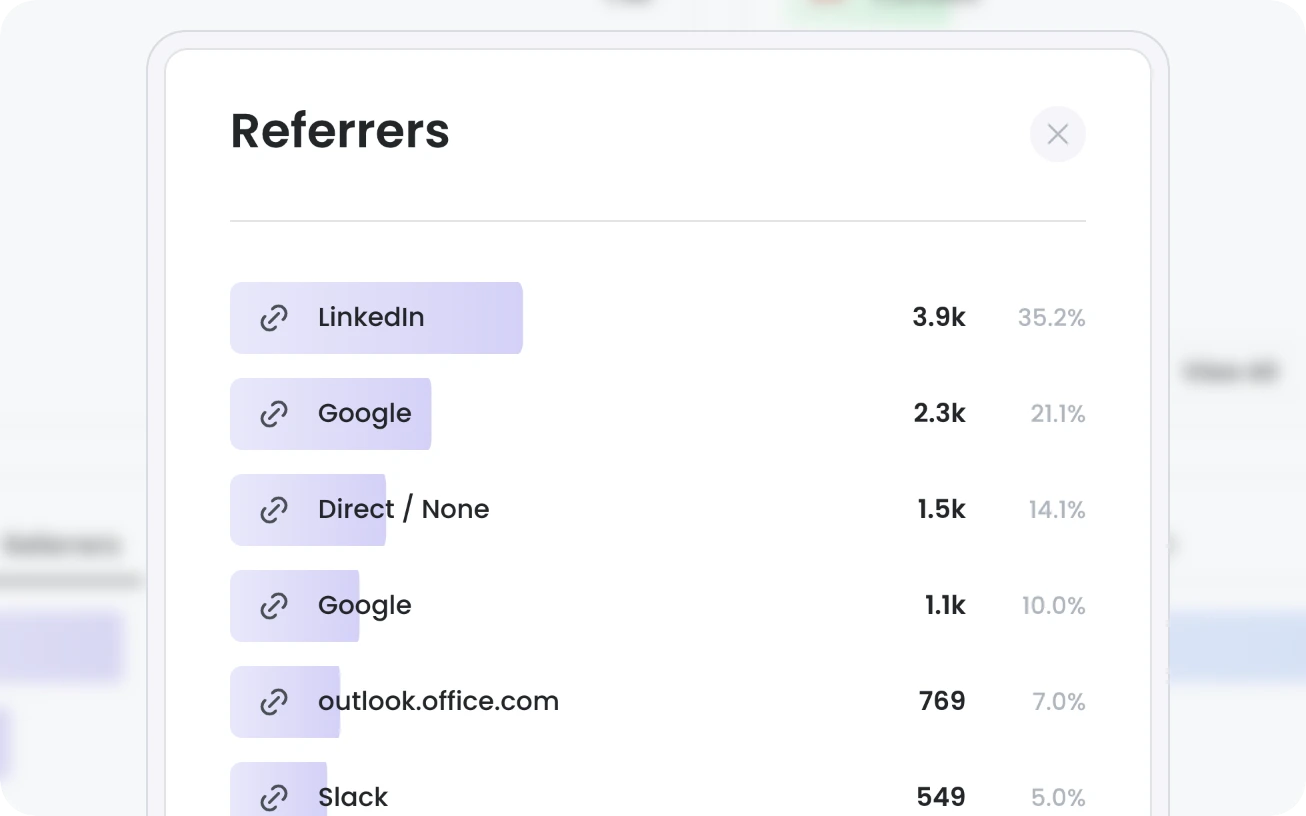
Referrers
Connect every view to its source. See whether LinkedIn, QR scans, or direct shares are doing the work, and double down on the channels that deliver.
On the roadmap
A lead-gen layer routes engagement signals into your pipeline, with alerts, follow-up workflows, and integrations that turn networking into measurable revenue. It builds on the same engagement data behind Networking and Activity today.
See how Social Card fits your team, your brand, and your rollout goals.